 ar
ar bg
bg hr
hr cs
cs da
da nl
nl fi
fi fr
fr de
de el
el hi
hi it
it ko
ko no
no pl
pl pt
pt ro
ro ru
ru es
es sv
sv tl
tl iw
iw id
id lv
lv lt
lt sr
sr sk
sk sl
sl uk
uk vi
vi et
et hu
hu th
th tr
tr fa
fa ms
ms hy
hy ka
ka ur
ur bn
bn mn
mn ta
ta kk
kk uz
uz ku
ku
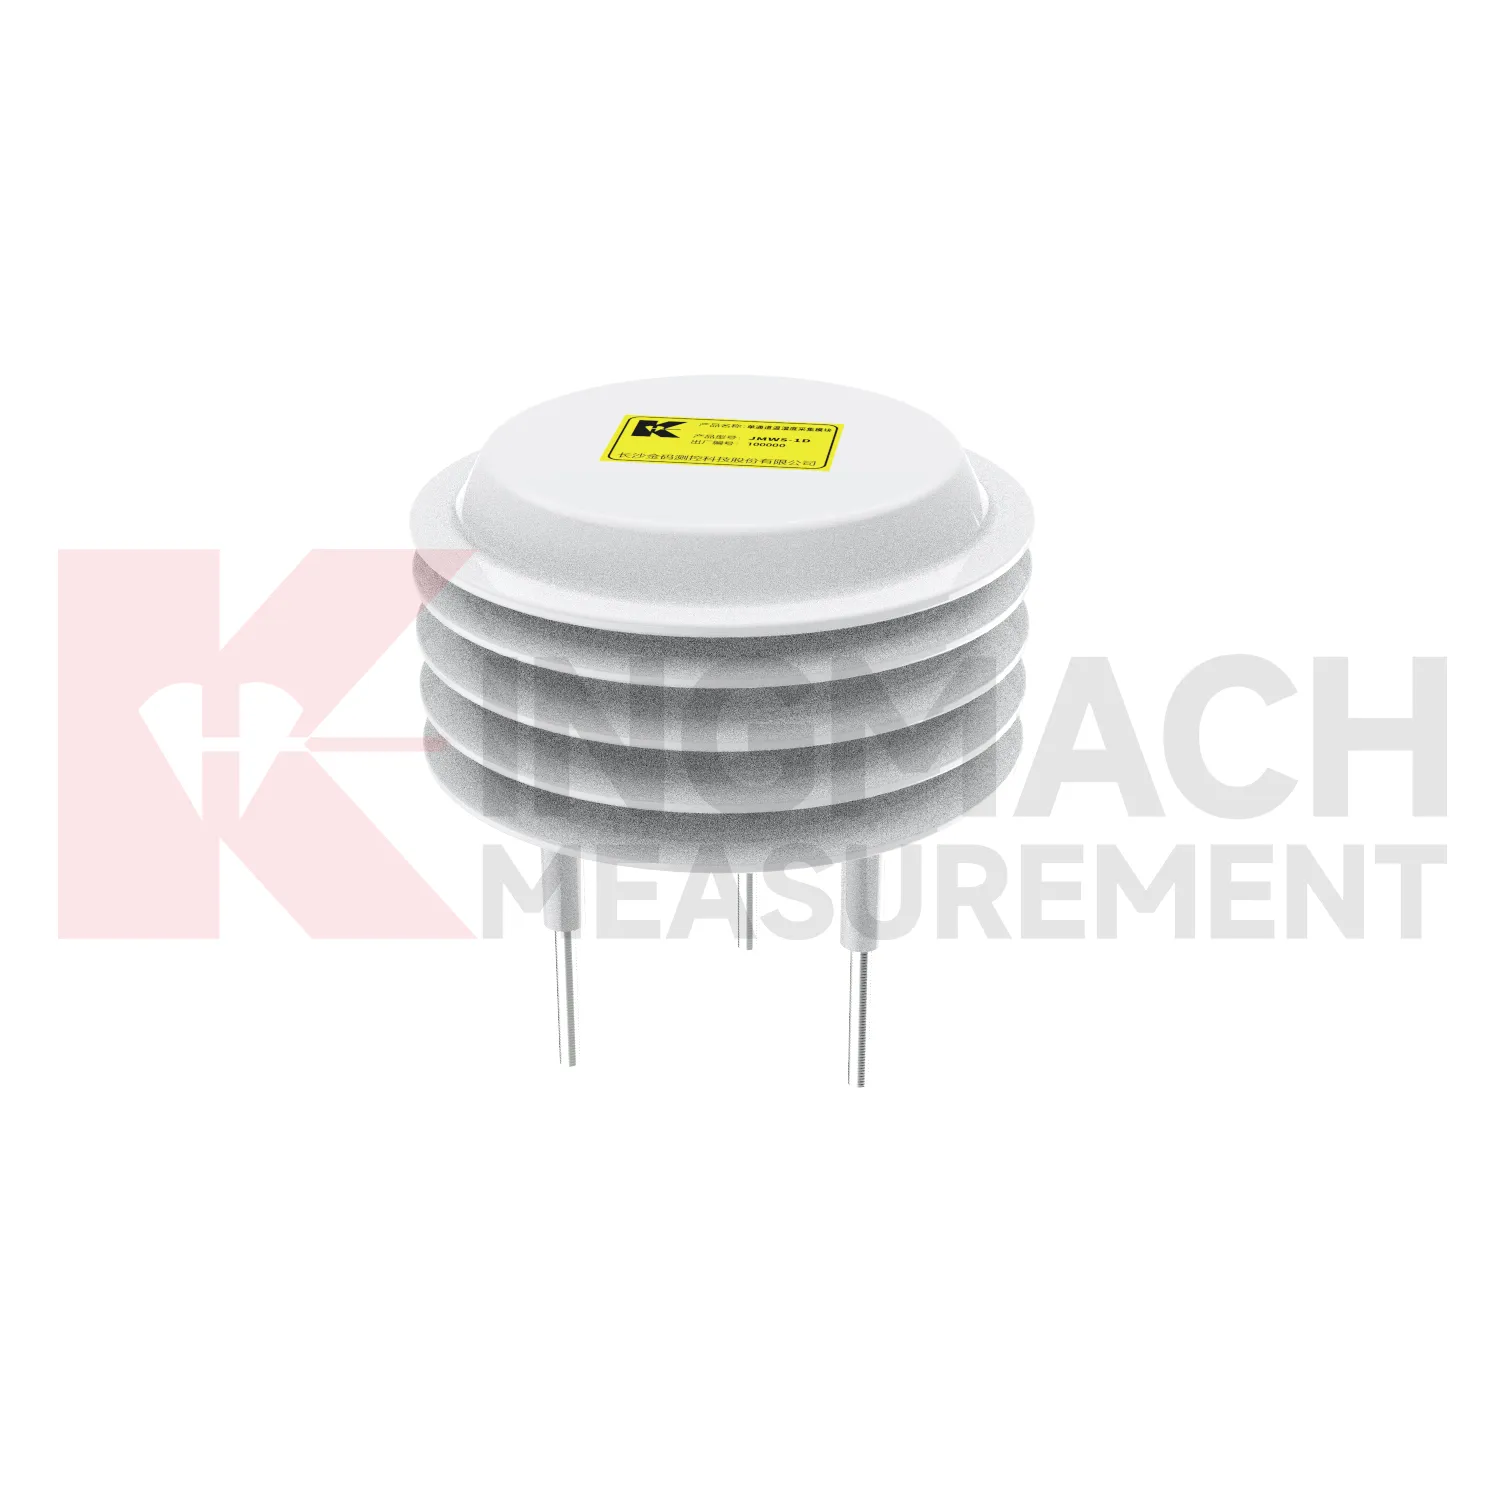
Daisy-Chained Digital Thermometer
Data acquisition for Kingmach Daisy-Chained Digital Thermometer should be organized around units, time, and relationships. Environmental channels may report rainfall, wind, pressure, temperature, humidity, or soil wetness, and each needs a clear unit and location. A mixed station becomes confusing if channel names are vague or if the data logger does not preserve the relation between environmental points and structural points. The project file should define which environmental channel supports which engineering review. Rainfall may connect to slope movement. Wind may connect to vibration. Temperature may connect to strain. Humidity may connect to cabinet maintenance. A simple channel map can save a great deal of time during an alarm. Good acquisition practice makes environmental data reliable enough to use when the site is under stress.
Long-term value comes from consistency. A channel that keeps the same location, unit, maintenance history, and linked asset record can support seasonal comparison, post-storm review, and handover between construction and operation teams.
Maintenance teams should record cleaning, access difficulty, enclosure condition, cable repair, vegetation growth, nearby equipment changes, and the first normal reading after work. Those notes protect the meaning of the curve when old data is reviewed months later.
The environmental point should be part of a named monitoring question. It may explain wetting, drying, wind exposure, thermal movement, cabinet stress, or pressure variation, but that purpose needs to be visible in drawings and reports.


Application of Daisy-Chained Digital Thermometer
Construction sites use Kingmach Daisy-Chained Digital Thermometer to document conditions that affect work, monitoring data, and later dispute review. Rain can change excavation safety, slope behavior, access roads, concrete work, and water management. Wind can affect lifting, temporary structures, and exposed frames. Temperature and humidity can affect curing, equipment rooms, and sensor cabinets. Environmental data should be collected where it represents the active work zone and should be reviewed beside displacement, settlement, vibration, crack, and inspection records. If a movement change occurs after a storm or heavy wind event, the environmental timeline helps engineers explain the timing. It also gives contractors and owners a shared record instead of relying on memory or informal weather notes.
A practical report links the condition value with time, place, and action. It should help a reviewer decide whether to keep observing, inspect the field point, compare nearby instruments, or record the event as normal site behavior.
For owners, the strongest record is the one that remains understandable after staff changes. Clear units, plain point names, installation photos, maintenance notes, and linked structural channels make the data usable beyond the original project team.
For field teams, this point is most useful when the record shows the condition before the structural response, during the response, and after the site returns to routine operation. The note should include weather timing, inspection access, nearby construction, and whether the linked structural points changed in the same period.
The future of Daisy-Chained Digital Thermometer
The future of Kingmach Daisy-Chained Digital Thermometer will focus on linking environmental triggers directly to structural behavior. Owners do not only need to know that rain fell, wind rose, or humidity changed. They need to know whether those conditions explain movement, strain, vibration, seepage, or equipment faults. Future monitoring reports should place condition curves and structural curves on the same timeline with inspection notes. That will make it easier to distinguish weather-driven behavior from progressive deterioration. The practical improvement is not more scattered data; it is clearer relationships. When environmental records are connected to the assets they affect, engineers can review alarms faster and plan field checks with better evidence.
This direction will also change how warning levels are written. A slope warning may depend on rainfall history and wetting trend, while a bridge warning may depend on wind period and structural response. Future systems should allow these links to be visible instead of forcing every channel into one isolated threshold.
For owners, the benefit is a shorter path from alarm to action. A reviewer can see the condition that changed, the asset that reacted, the inspection that followed, and whether the response returned to normal. That is more useful than separate charts that require manual reconstruction.
Care & Maintenance of Daisy-Chained Digital Thermometer
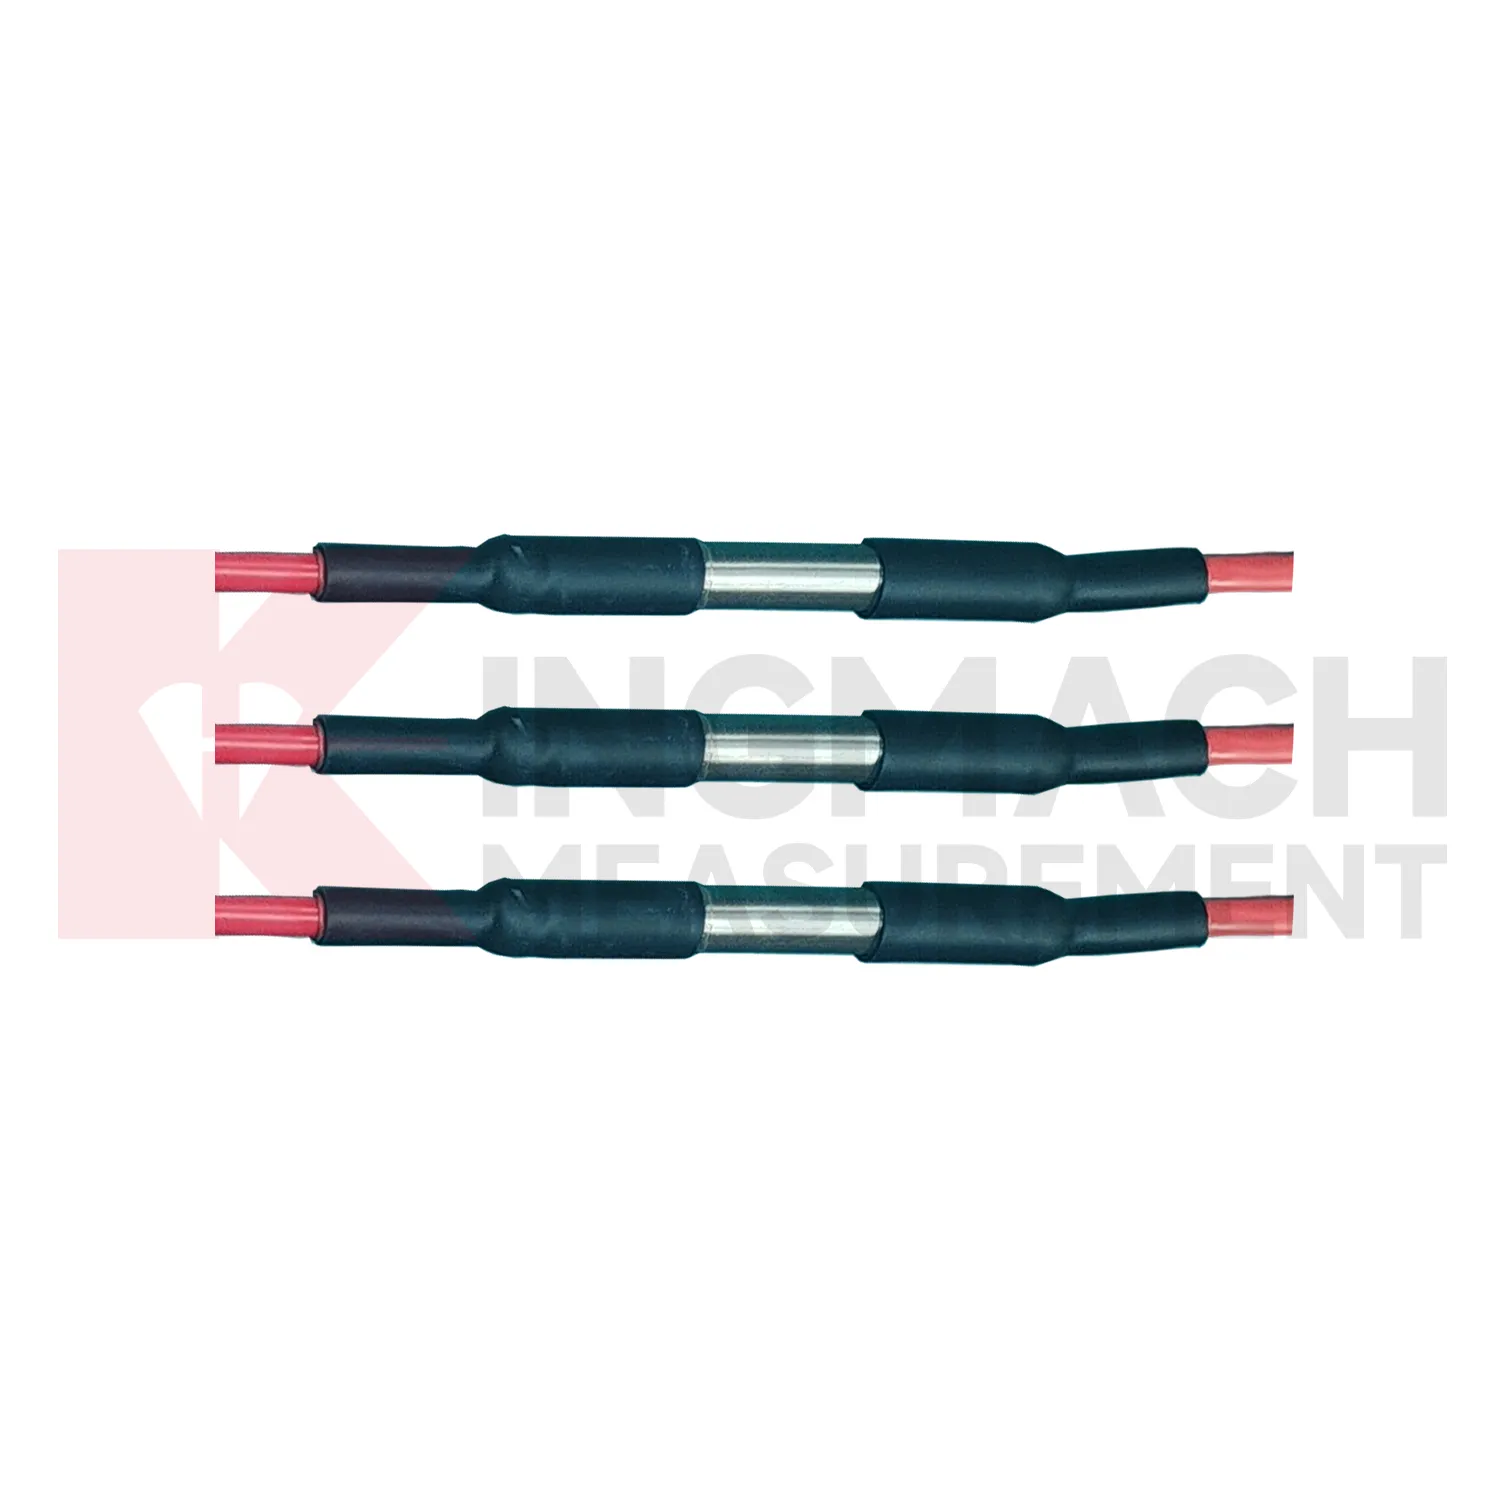
Communication and unit checks are essential for Kingmach Daisy-Chained Digital Thermometer. Environmental stations may contain rainfall, wind, pressure, humidity, temperature, and soil-condition channels with different units and signal paths. After cabinet work, software changes, or data logger replacement, confirm that each channel still points to the correct location and unit. A swapped channel can turn a useful record into a confusing report. Wiring diagrams, channel tables, scale factors, and point photos should be kept together. During an alarm, the reviewer should not have to guess whether a curve is wind speed, pressure, rainfall, or humidity. Clear communication records make environmental data usable under pressure.
Maintenance teams should record cleaning, access difficulty, enclosure condition, cable repair, vegetation growth, nearby equipment changes, and the first normal reading after work. Those notes protect the meaning of the curve when old data is reviewed months later.
The environmental point should be part of a named monitoring question. It may explain wetting, drying, wind exposure, thermal movement, cabinet stress, or pressure variation, but that purpose needs to be visible in drawings and reports.
Kingmach Daisy-Chained Digital Thermometer
Rainfall records are a central part of Kingmach Daisy-Chained Digital Thermometer for slopes, embankments, dams, tunnel portals, and construction sites. Rain does not always cause immediate movement; water may enter the ground, raise pore pressure, soften material, or change runoff over time. That delay is exactly why a dated rainfall record matters. Engineers can compare the storm start, rainfall duration, peak intensity, soil response, and movement curve. Without that record, a slope alarm may be discussed as a vague weather event. With it, the team can see whether movement followed the storm, whether it continued after rain stopped, and whether field inspection is needed. Rain data becomes part of the engineering timeline rather than a background note.
The environmental point should be part of a named monitoring question. It may explain wetting, drying, wind exposure, thermal movement, cabinet stress, or pressure variation, but that purpose needs to be visible in drawings and reports.
If the reading seems unusual, the team should check the physical condition of the station before drawing conclusions about the asset. Blockage, poor exposure, loose wiring, water entry, and changed surroundings can all create misleading patterns.
FAQ
Q: How does rainfall data support slope review?
A: Rainfall gives the timing and intensity background for movement, seepage, wetting, and field inspections after storms.
Q: Why measure soil wetness as well as rainfall?
A: Rainfall stays at the surface record, while buried wetness shows whether water reached the soil depth that may influence movement.
Q: How does wind data support bridge or tower monitoring?
A: Wind direction and exposure can explain vibration, deflection, access difficulty, and weather-driven structural response.
Q: Why monitor humidity underground?
A: Humidity can affect cabinets, connectors, corrosion, sensor stability, and operating conditions in tunnels, subways, mines, and equipment spaces.
Q: How does temperature help interpretation?
A: Temperature helps reviewers separate thermal behavior from structural change in strain, displacement, cabinet condition, or material response.
Long-term value comes from consistency. A channel that keeps the same location, unit, maintenance history, and linked asset record can support seasonal comparison, post-storm review, and handover between construction and operation teams.
Reviews
Matthew Garcia
Instrumentation cables are durable and perform well even in harsh environments. Will definitely order again.
Christopher Martinez
Very satisfied with the readouts & data loggers. User-friendly interface and supports multiple sensor inputs.
Latest Inquiries
To protect the privacy of our buyers, only public service email domains like Gmail, Yahoo, and MSN will be displayed. Additionally, only a limited portion of the inquiry content will be shown.
Charlotte***@gmail.comUnited Arab Emirates
Hi, we require instrumentation cables suitable for harsh environments. Could you advise on specifica...
Sophia***@gmail.comUnited Kingdom
Good day, we need environmental monitoring sensors including temperature, humidity, and wind sensors...
Related product categories
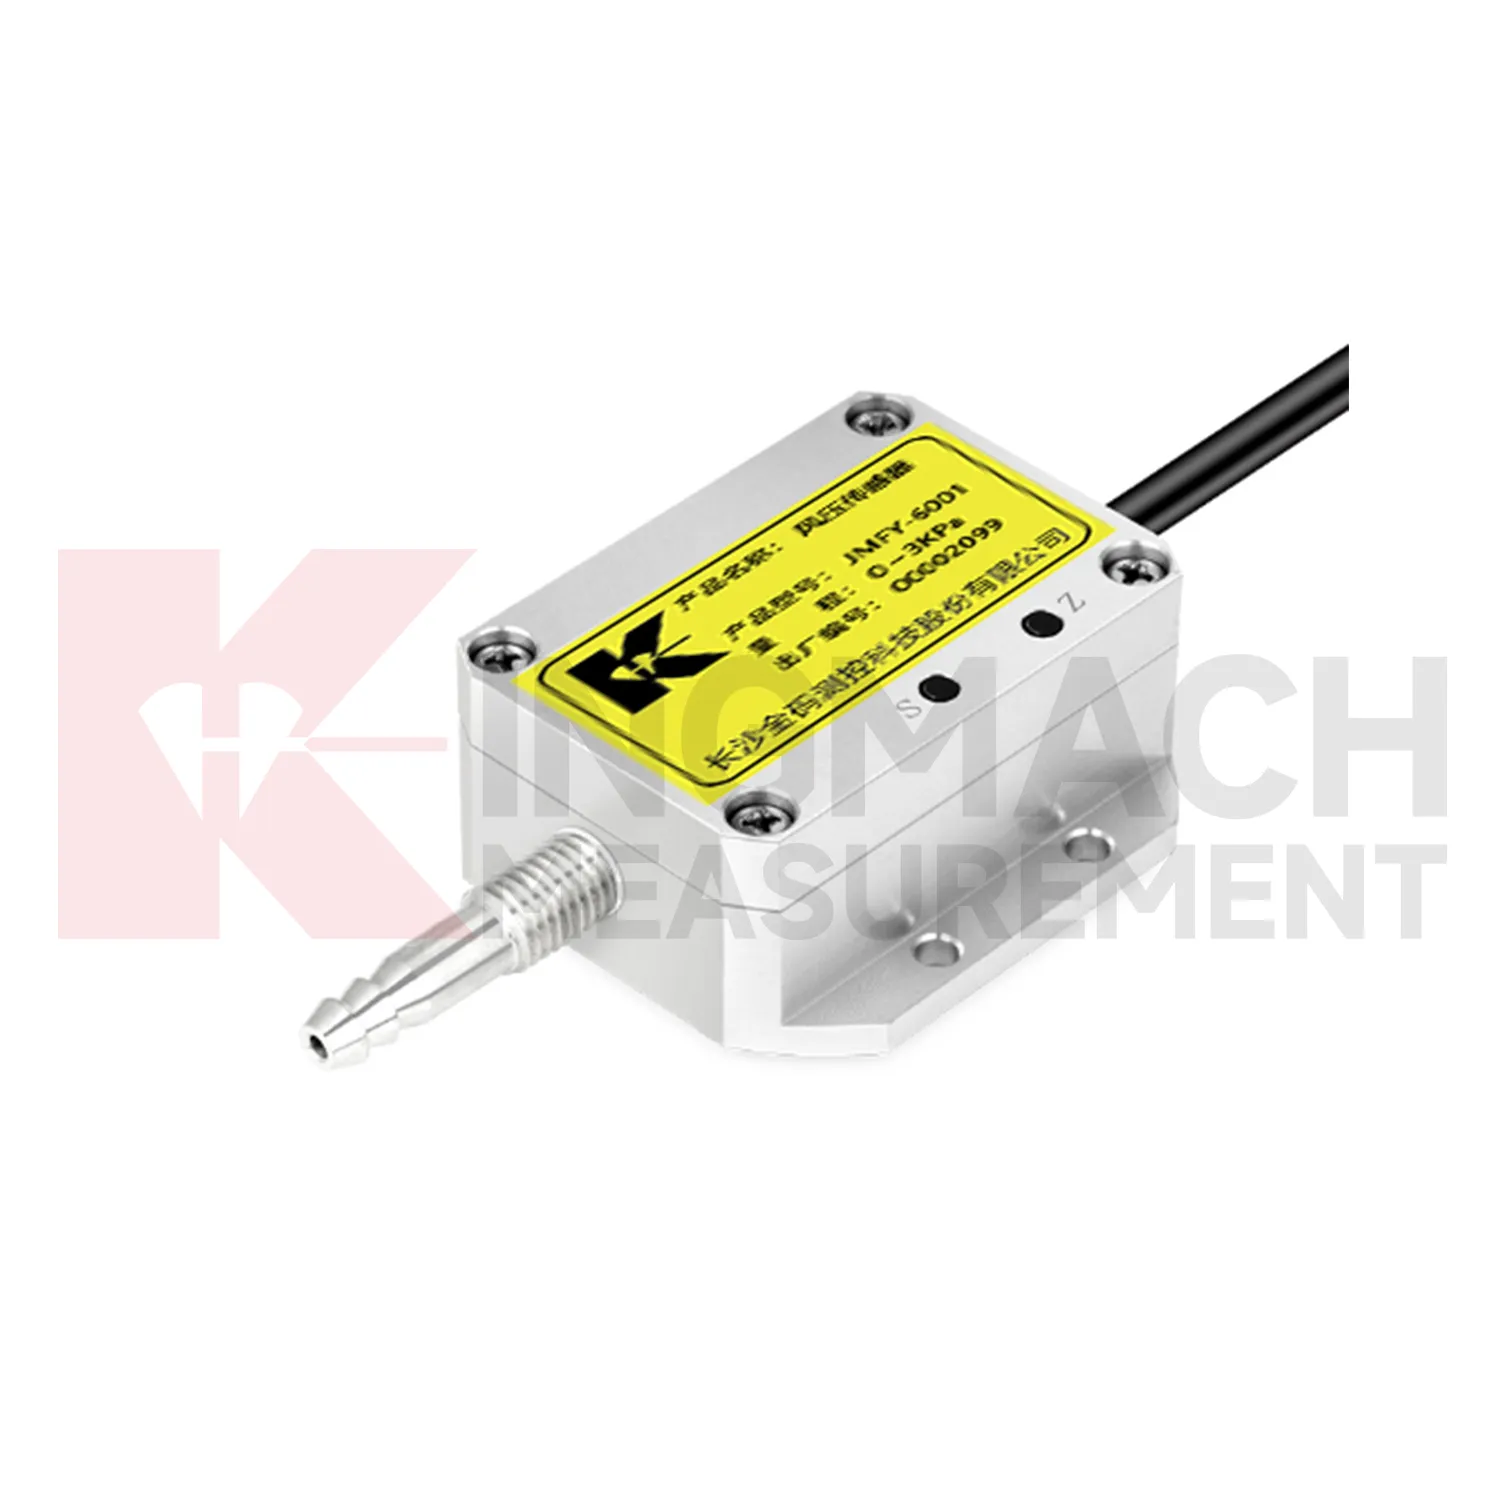
- wind pressure sensor
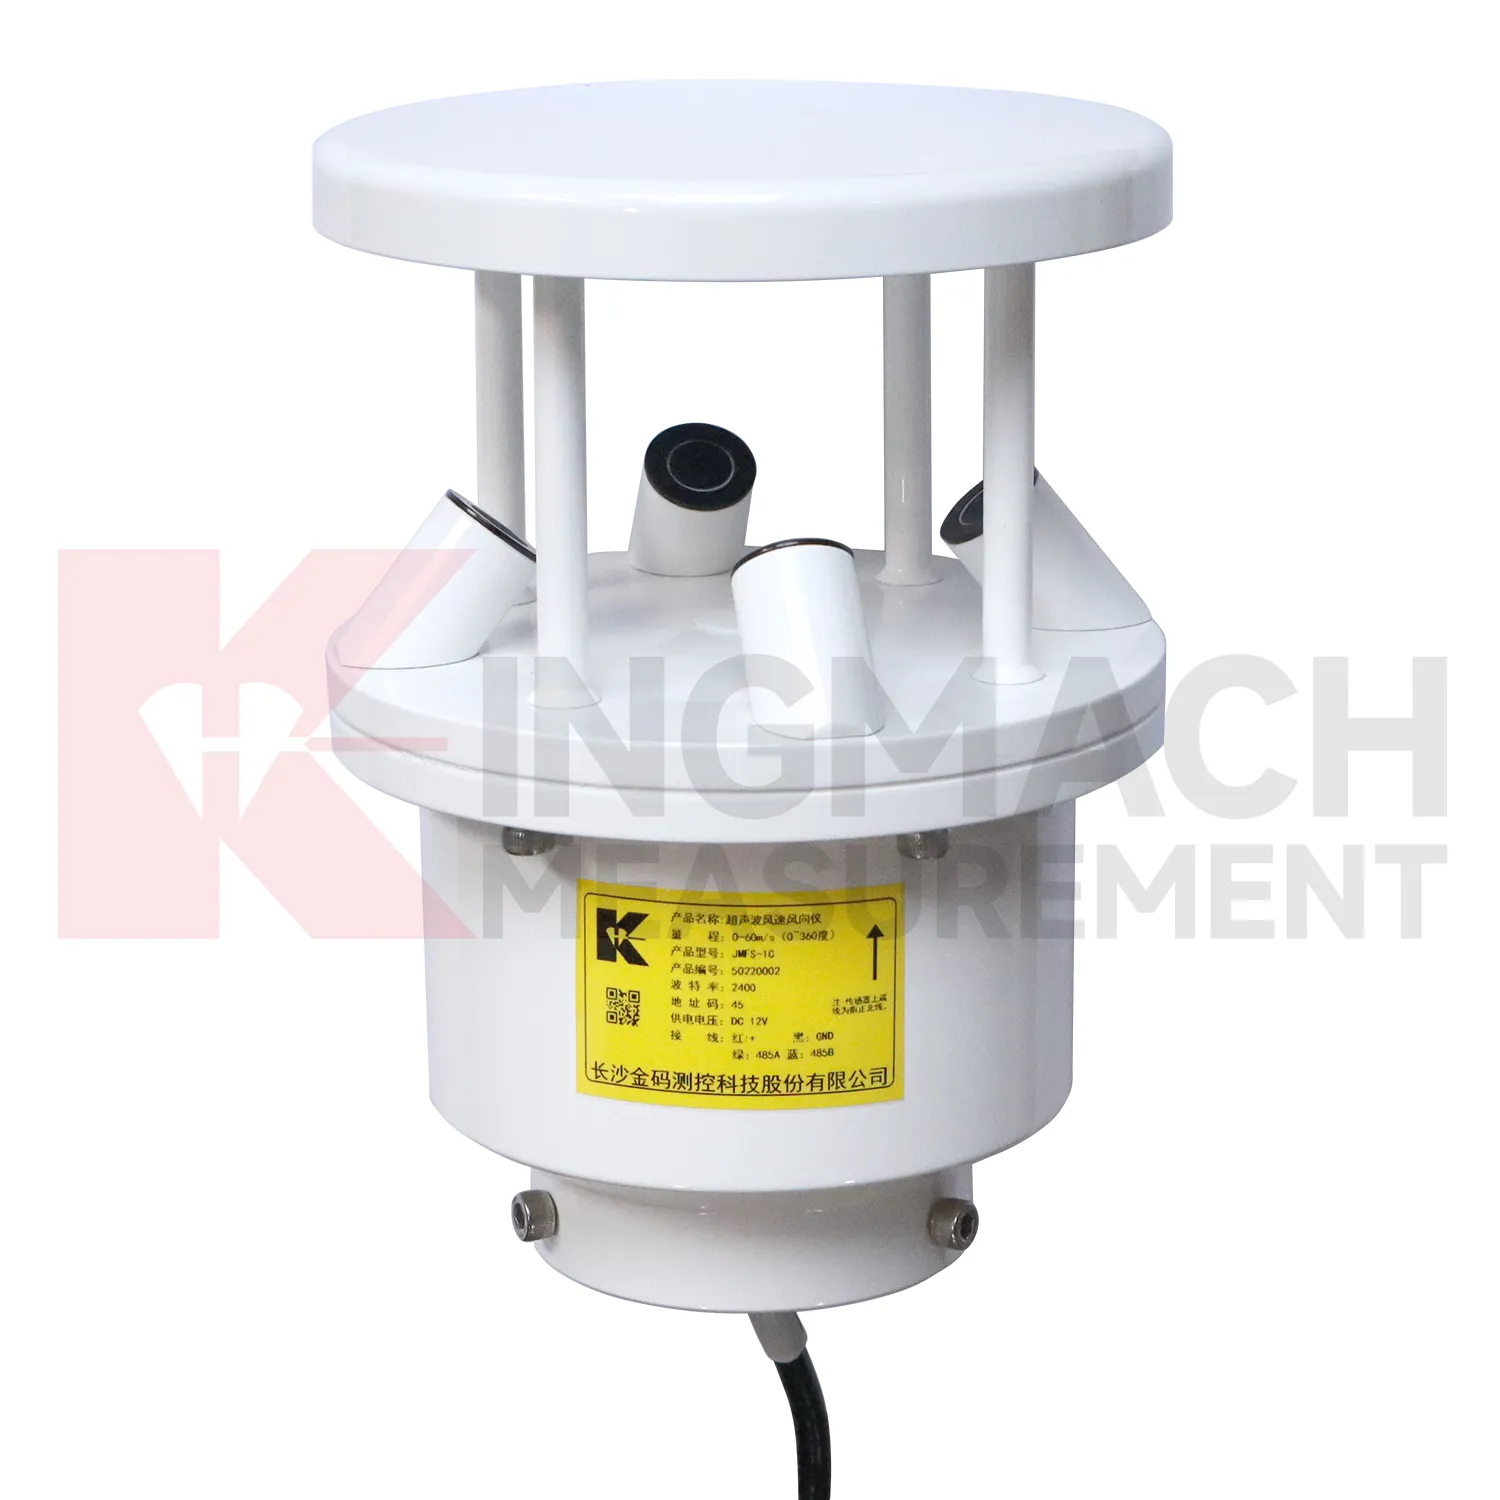
- ultrasonic wind speed and direction sensor
- wind speed and direction sensor
- wind speed and wind direction sensor
- wind speed and direct sensor
- wireless wind speed and direction sensor
- wind direction and speed sensor
- wind speed and direction sensors
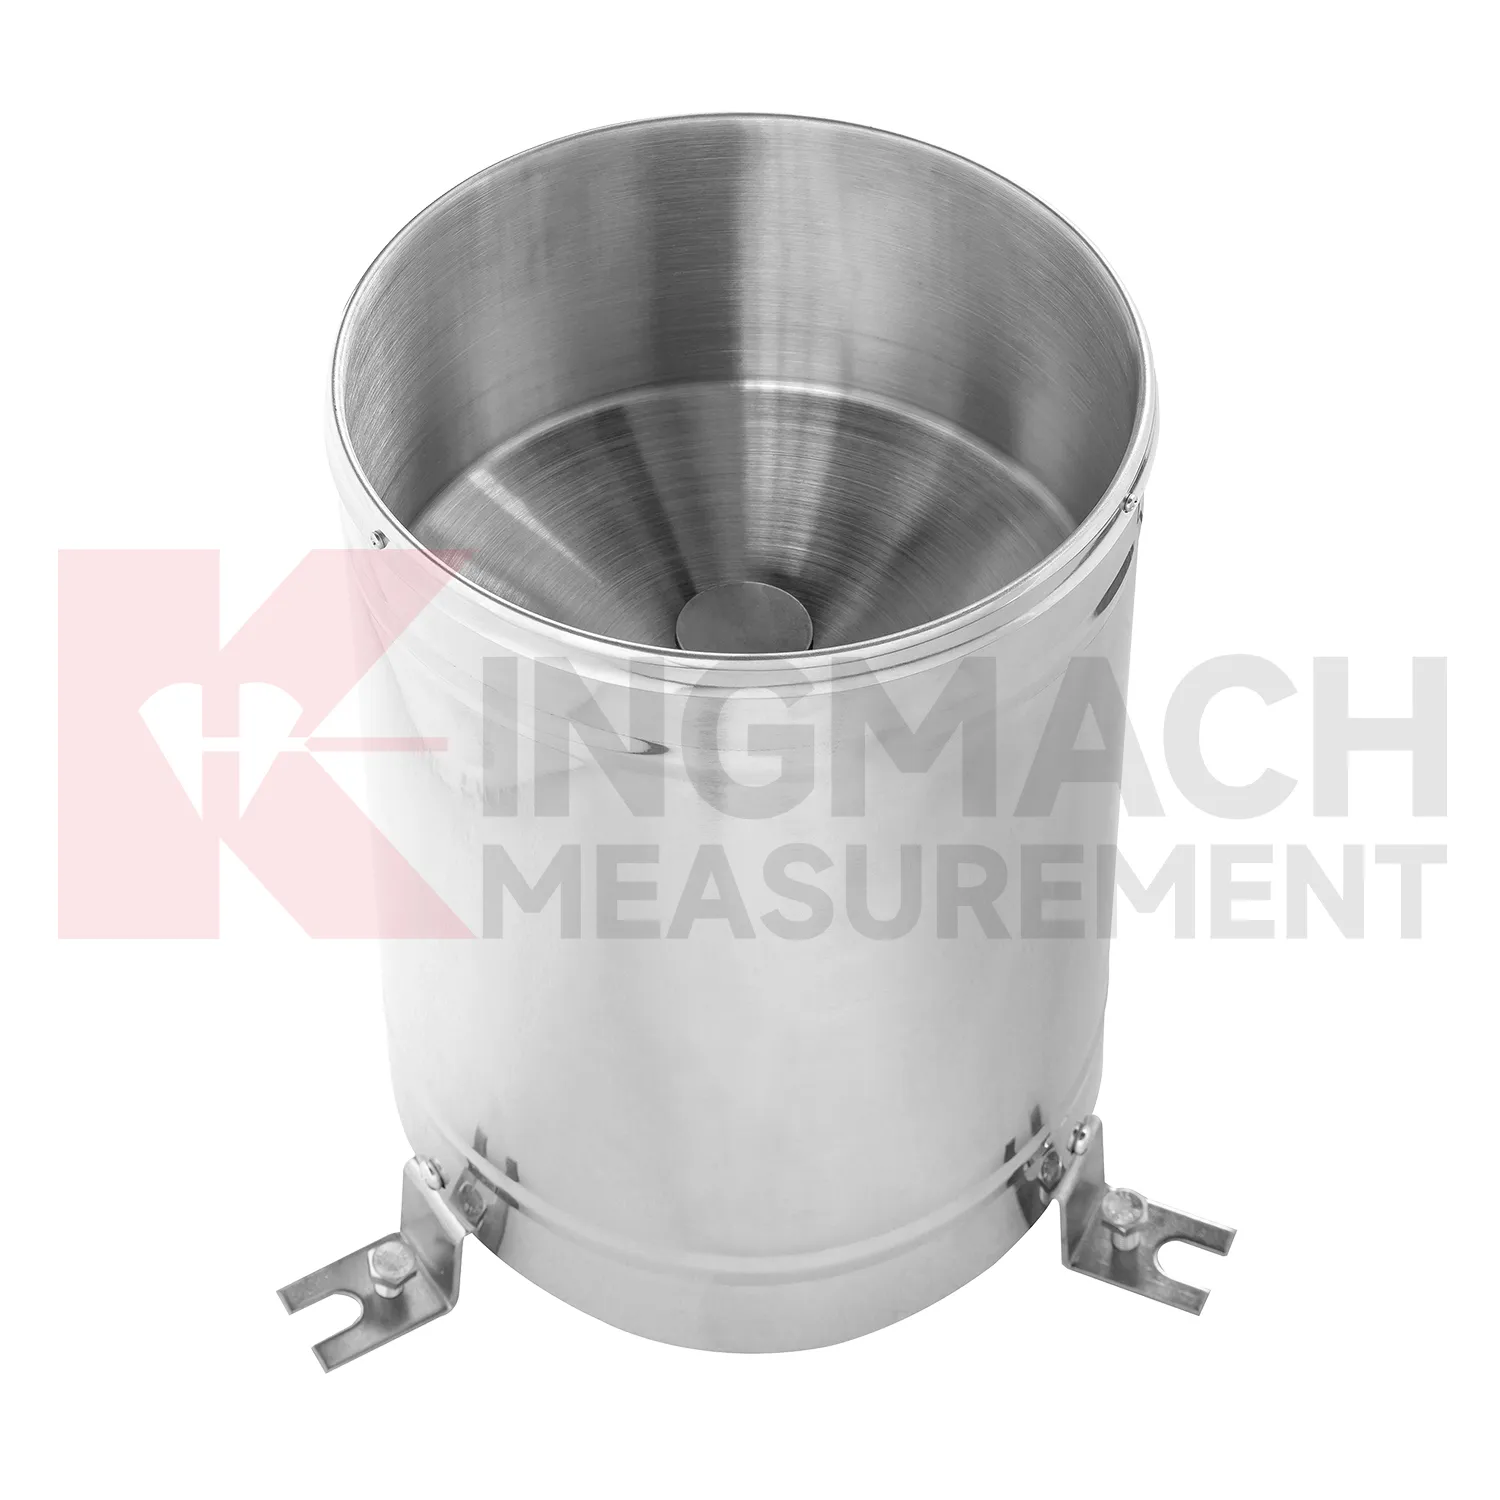
- tipping bucket rain gauge
- tipping bucket rain gauge resolution 0.2 mm standard
- tipping bucket rain gauges
- tipping bucket rain gauge resolution 0.1 mm 0.2 mm standard